

Frequency Response
Frequency response.
The frequency response is way to characterise how an audio system
performs. Microphones, amplifier, and loudspeaker have frequency responses.
A frequency response diagram shows how the sensitivity of an item changes with
frequency. The horizontal or X-axis is the frequency axis along the bottom of
such a diagram. The vertical or Y-axis is the sensitivity or output level.
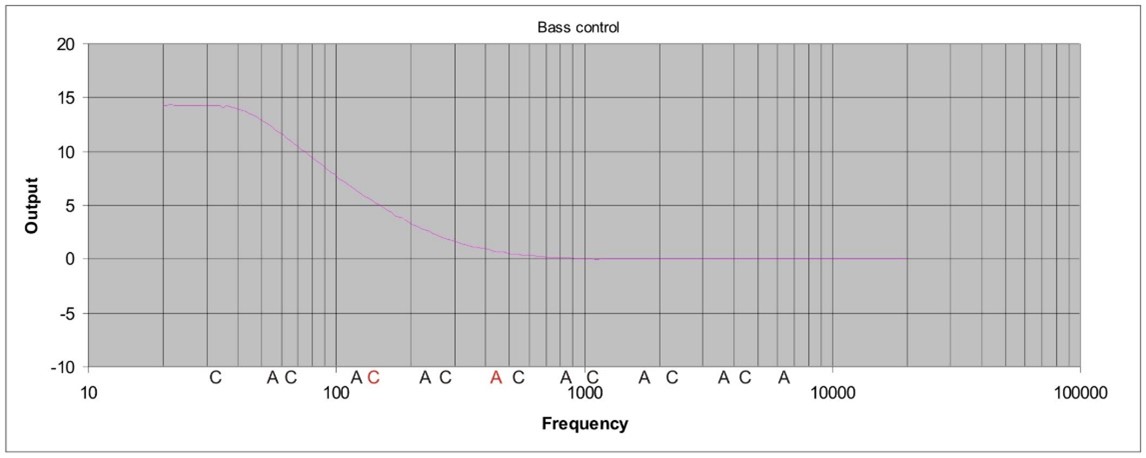
Fig 1. Frequency response of a Bass Tone control.
The diagram above
shows the frequency response of a Bass Tone control when adjusted to max boost.
The bottom axis represents frequency from 10Hz to 100000Hz or 100kHz. (normal
hearing is considered to be 20Hz to 20kHz.) The vertical axis represents to
output from a reduction of 10dB to a boost of nearly 15dB. The pink line is the
response and is plotted from 20Hz to 20kHz only. This is a diagram of the
relative signal, i.e. the zero point indicates that there has been no change
not that there is no signal. Therefore the pink line, representing the response
of the bass tone control, indicates that the low frequency is boosted by nearly
15dB. This increase is a maximum at the lowest frequencies and decreases as the
frequency is increased until at 1000Hz there is no change in the output.
This is a very simple frequency response, many systems have responses which are not a smooth line like this. Generally the flatter the response, i.e. closer to 0dB all the way across, the better the system will sound. The more peaks and troughs would indicate that the item being measured is not going to sound natural. If a microphone has a flat response then it will pickup all frequencies equally well. If this then goes through an amplifier with a flat response and then a loudspeaker with a flat frequency response then the sound produced should be very close to the original. Of course this is only part of the total system which affects our perception of sound but it is an important starting point. As in the example, the addition of tone controls can change the response and this can be used to improve the sound or compensate for a lack elsewhere in the system.
For comparison some musical notes have been placed on the frequency axis. The red C is middle C, the red A is concert pitch A 440Hz. The other notes are the octave above and below these notes.